Improving Reporting Function on Communicative Access Measures for Stroke (CAMS) Platform

CAMS is a survey platform that helps healthcare facilities evaluate how well they communicate with people living with stroke and aphasia. They wanted to add an aggregation reporting function for their new client, a regional healthcare network spanning 17+ facilities in Ontario. I validated the new aggregation logic through 50+ calculations, fixed layout and instruction issues, and ran usability testing that reveal the real problem. Users can generate report, but they couldn’t confidently interpret them. I responded by adding an “Answer Rate” indicator and changing the calculation methodology to reflect who answered each question and its distribution, so each graph told more complete and accurate picture.
Project Time: 4 months
My Role: UX specialist
Methods used: Usability Testing
Challenges
CAMS is a survey platform that helps healthcare facilities track staffs communication efficiency with people living with aphasia and stroke. When a local healthcare networker recently adopted the platform to conduct surveys across multiple facilities and compare data against other locations within the network, they encountered key challenges. The platform lacked aggregation and comparison functions, forcing teams to struggle to trust the accuracy of combined metrics.
To support this need, the Aphasia Institute introduced a "facilities combination" reporting feature, allowing users to view aggregated data across multiple facilities.
Goals
Ensure the accuracy and reliability of data and calculations within the report function.
Identify opportunities to improve the user experience on the platform.
Evaluate whether users can effectively gain actionable insights and interpret information through the reporting visualizations.
My role
UX Specialist on a team with a project coordinator and tech consultants. Responsible for:
Validation testing
Workflow analysis
Usability testing
Report methodology redesign
Stakeholder collaboration
Approach
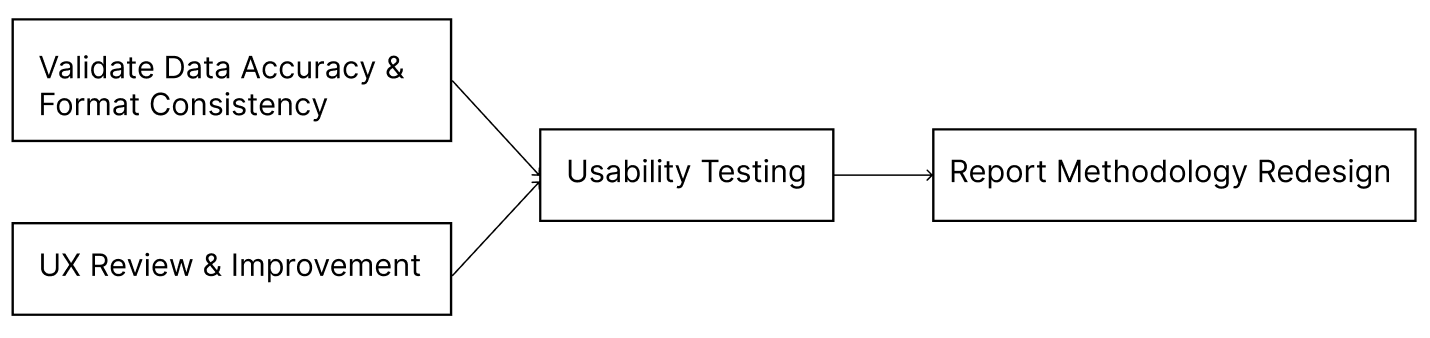
Process

Calculation integrity
Designed multiple test scenarios and conducted 50+ manual calculations to validate the aggregation logic on 3 surveys, 2 comparison types (internal/external) and 2 question formats (single/multi-select).
After

Layout stability
Long facility names broke chart labels. Added a 40-character report name field in the registration workflow.

Contextual instructions
Instructions for all report type displayed at once. Now only the steps for the selected report type appear.
Usability Testing
After launching the combination function, I ran two moderated usability sessions with healthcare managers to answer one question: How might we help healthcare managers confidently generate reports to compare survey results across facilities and over time?
I broke the reporting workflow into five tasks:
1. Shorten the facility’s name
2. Go to the report page
3. Combine two survey rounds from two facilities - internal/external
4. Save a report
5. Interpret a report
Both managers completed every task, but neither felt confident interpreting the results once the report in front of them. As one put it:
“The tool is easy to use, but I need abundant background knowledge to use this tool.”
The cause was the chart itself. Because survey questions were optional, a graph didn’t always show the full distribution of responses. Managers struggled to read it and explain it to their own managers.
This changed how I framed the problem. Until then, the website coordinator had been trying to explain the calculation methods in the instructions, and the solution was a handbook that users were expected to read when they ran into trouble. However, asking users to read a manual before every use wasn’t an effective way to reduce cognitive load during reports generation.
The testing showed me that managers didn’t care about the formula, they care about the story the graph told, and whether they could trust it.
So I stopped trying to teach the math and made the graphs explain themselves:
Added an “Answer Rate” indicator, so user can judge how reliable each graph is.
Changed the denominator from everyone who submitted the survey to everyone who answered the question, and showed the actual response counts on the graph.
Before
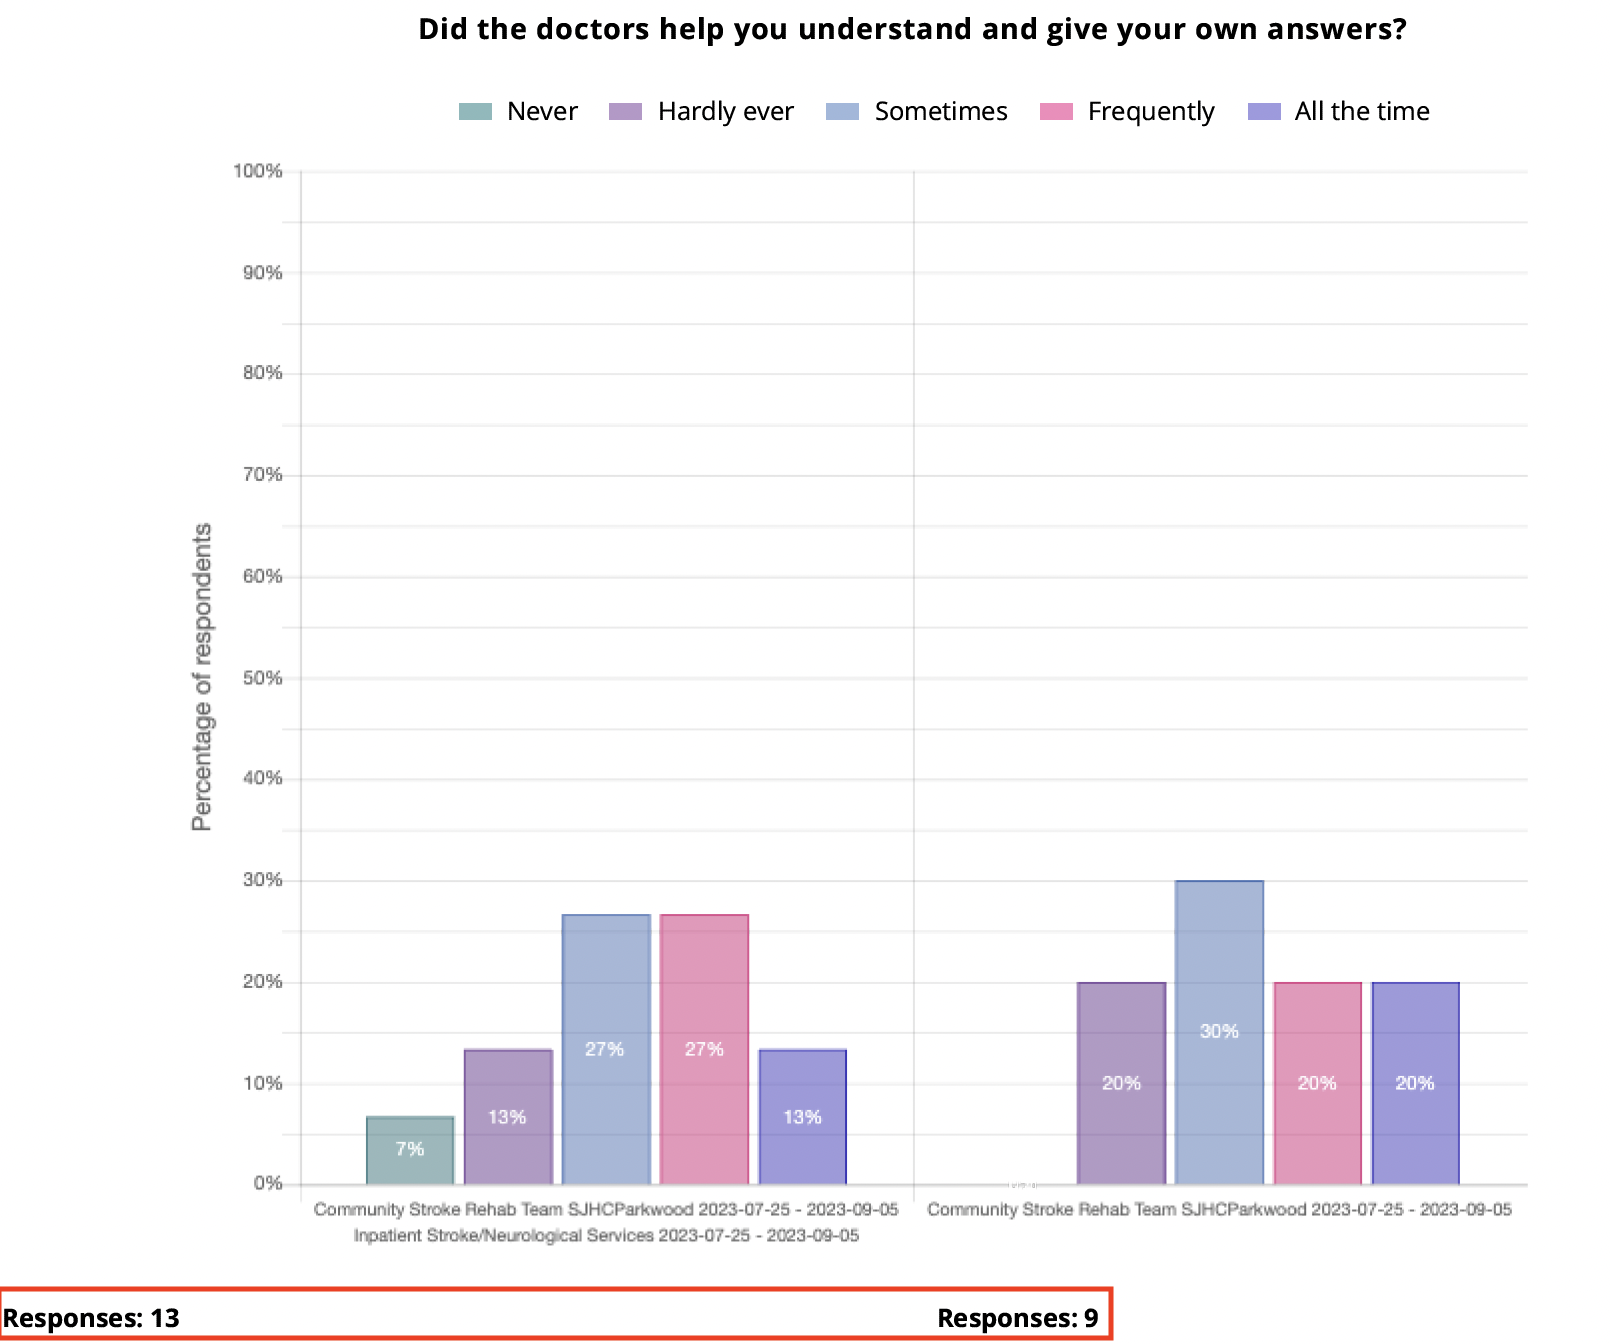
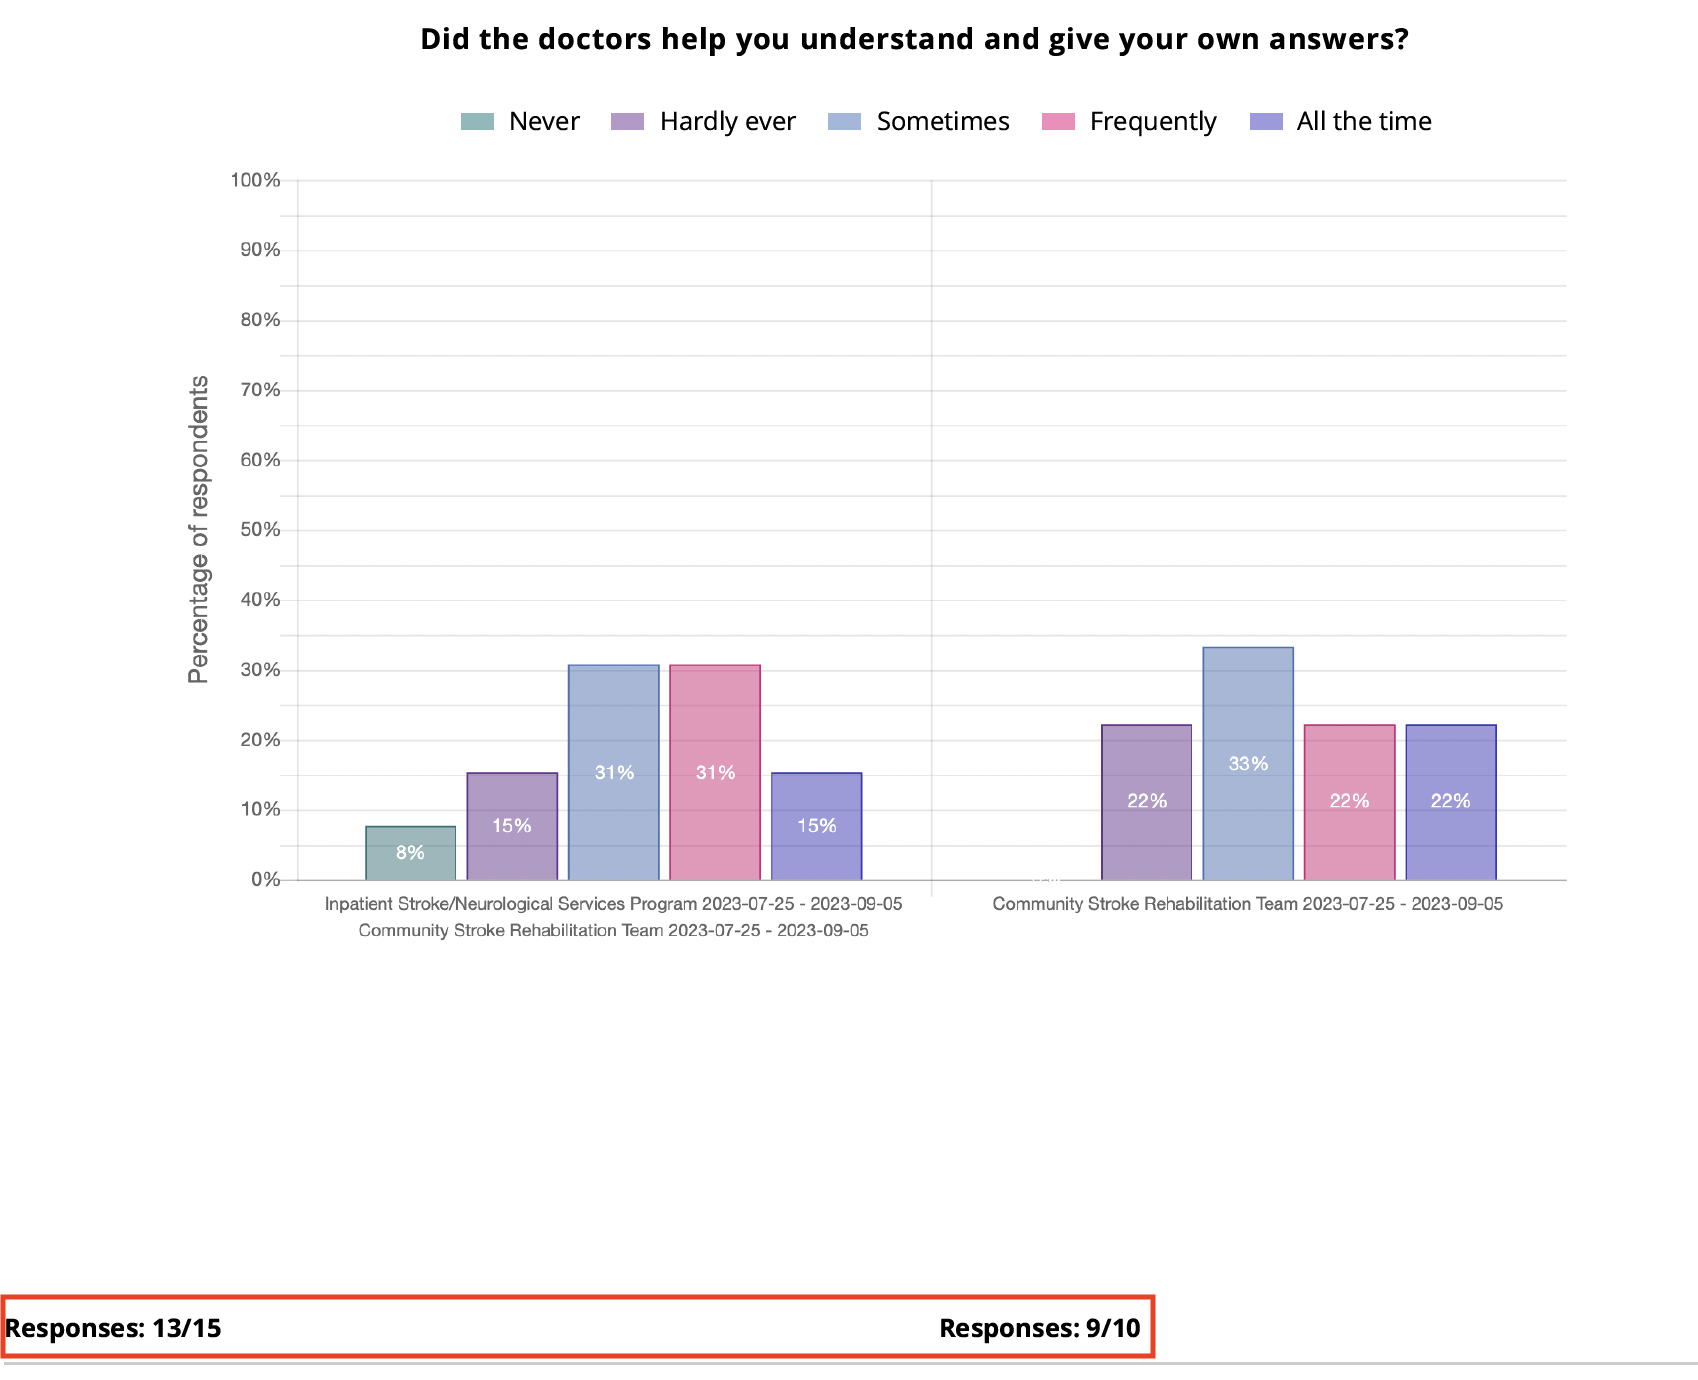
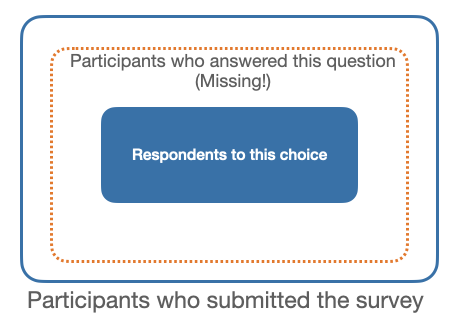
15 participants submitted the survey, and 13 participants responded to this question.
10 participants submitted the survey, and 9 participants responded to this question.
Each graph bar % =
# respondents to that choice
divided by
# ppl who responded to that question x 100%
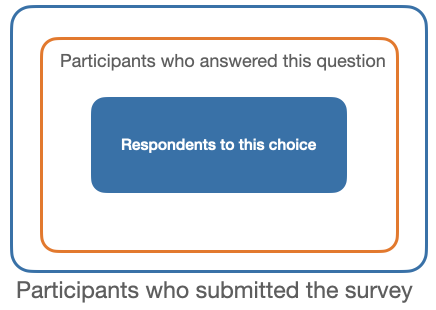
Together, these changes led to results that reflected the full picture and how responses were distributed, so each graph told a more complete and accurate story. This solution had been verified with the external statistic consultant and been implemented on the graphs on the whole website.
Impact
Ensured 100% data accuracy and prevented layout breaking across all report types after implementing the new aggregation function, providing service to 17+ healthcare facilities under the Ontario local network.
Introduced context-aware progressive disclosure to streamline report creation, and refined baseline calculation formulas to make data interpretation intuitive for users.
Promoted user-centred thinking to the management team, shifting product maintenance from heavy instructional text to intuitive patterns.
Takeaways
Users are powerful! Usability testing brought a key ‘aha!’ moment, inspiring me to reframe the problem and providing me strong evidence to propose the new reporting methodology.
if I had a more time, I would conduct the usability testing with more participants to increase reliability and validate whether the methodological improvements enhanced user interpretation.
Use plain language to integrate core UX concepts into non-design teams’ work routine, which can satisfy the team and create impact within tight time and budget constraints.
13 & 9 participants submitted the survey
Each graph bar% =
# respondents to that choice
divided by
# total ppl who submitted the whole survey x 100%
-
![]()
A Hospital Mobile Portal Redesign
-
![]()
The Return Experience Research of The North Face
-
![]()
Wayfinding Experience of the Massachusetts Court System